
Retention is one of the most crucial metrics in SaaS. It tells you exactly how well your business is doing, whether you are crushing it or you’ve got a problem on your hands. Without a high retention rate, it’s very hard to build a profitable SaaS business at scale.
Retention rates have been some of the most requested SaaS metrics from our customers. We’re happy to announce we just rolled out two brand new charts, Net and Gross MRR Retention Rates.
In addition to seeing your top-line retention rates, you can also apply different filters and segment the data to help you identify what’s driving retention and with which groups of customers you have product-market fit. You can even calculate these metrics by month, quarter, or year to spot trends over time.
Calculating Net/Gross MRR Retention Rates
Gross Revenue Retention Rate shows you the percentage of revenue you retain from your customers, excluding expansion revenue. In effect, GRR tells you how successful you are at keeping your customers around. It’s calculated as:
Gross Revenue Retention Rate = ((MRR at the start of the period – MRR lost due to contraction & Churn) / MRR at the start of the period) x 100
The lower your GRR, the more you’re taking a hit from churn and contraction. The closer you are to 100% the better. Some churn is inevitable, but if you’re seeing this line trend in the wrong direction it’s time to figure out why and start plugging the leaks.
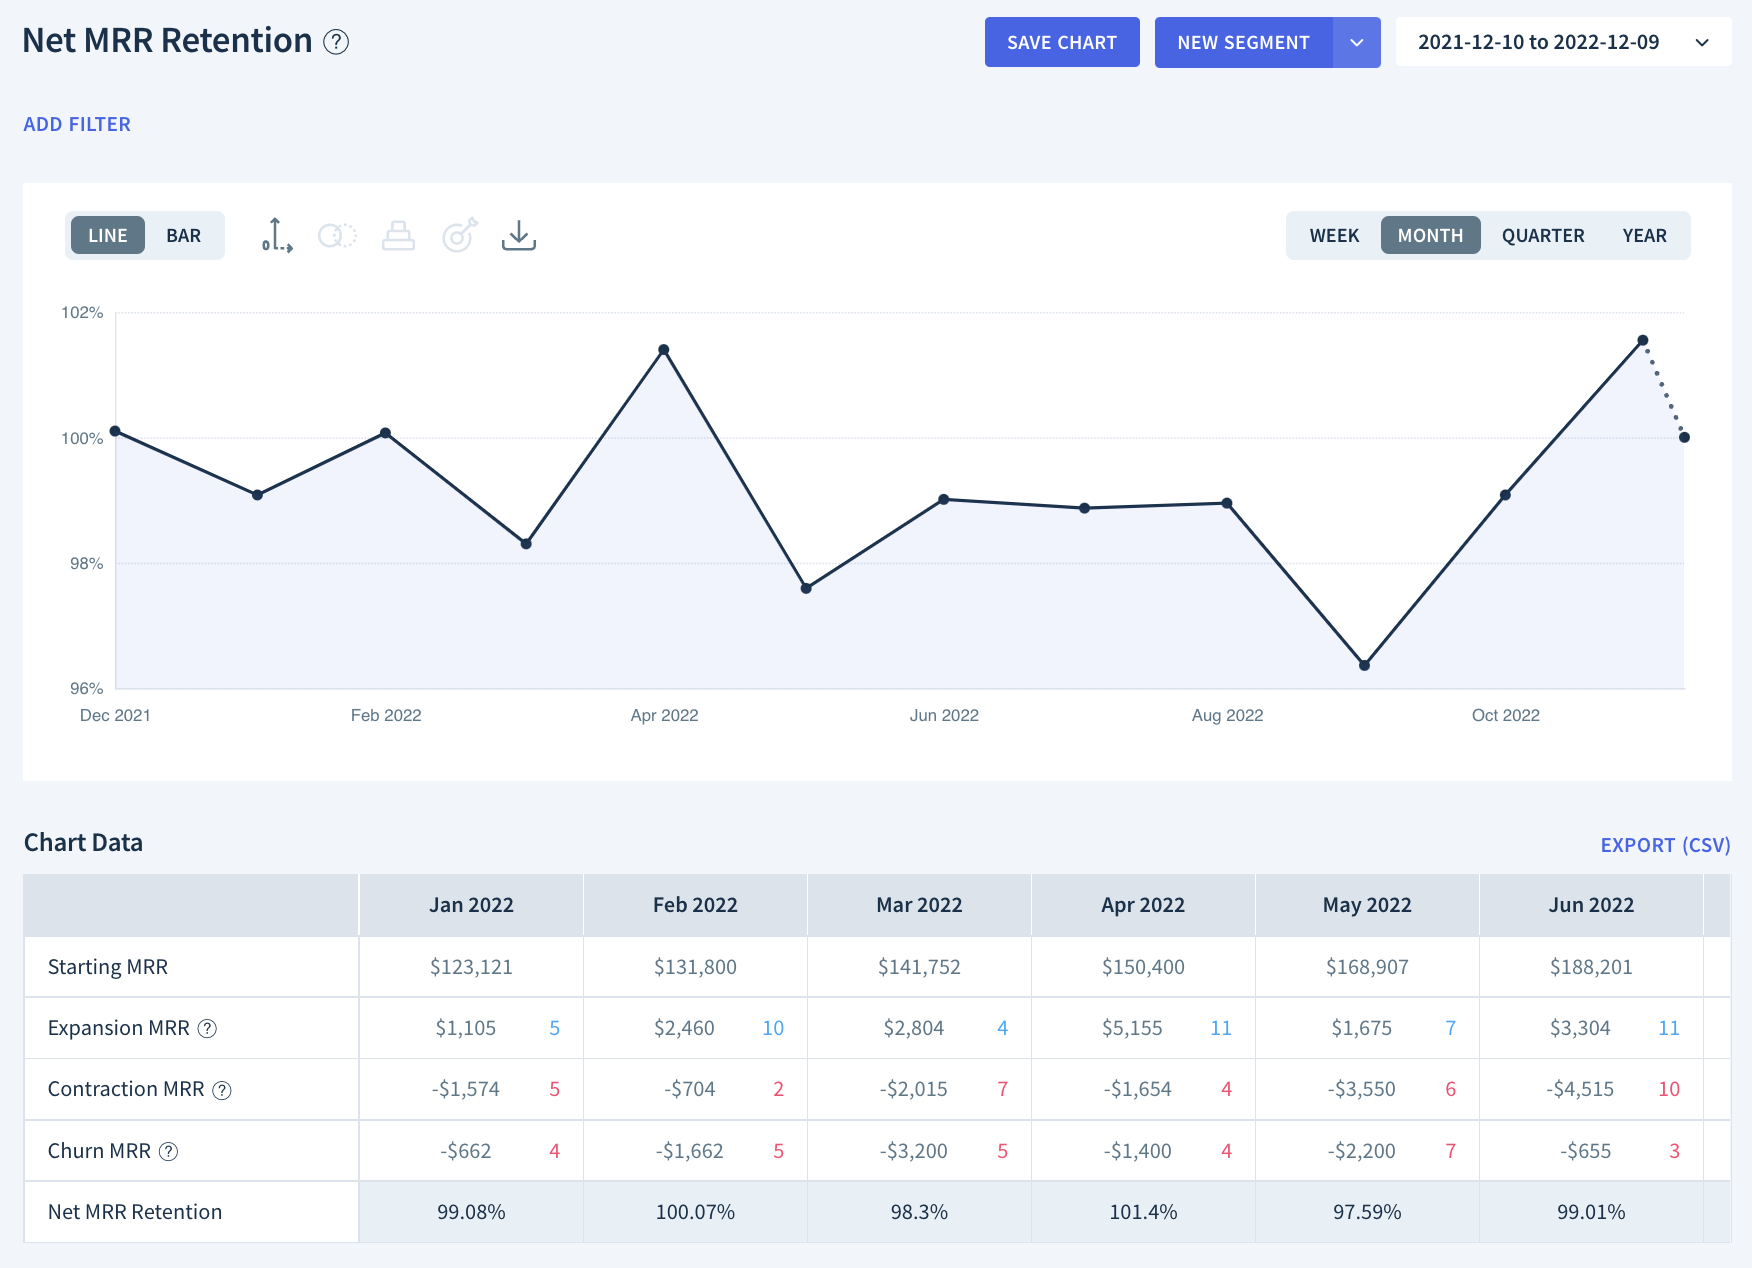
Net Revenue Retention is the percentage of revenue you retain from your customers in a given period including expansion MRR. Upgrades, upsells, and cross-sells all contribute to this calculation, so another way to put it is that NRR measures your customers’ success with your product. Here’s how it looks:
Net Revenue Retention Rate = ((MRR at the start of the period + MRR gained via Expansion – MRR lost due to contraction & Churn) / MRR at the start of the period) x 100
When calculating retention, only take into account MRR movements from customers present at the start of the period and exclude any new customers that joined mid-way.
Although you can calculate Gross & Net Revenue Retention across any time period, yearly retention numbers are most popular because they take into account the full renewal cycle.
“I’ve started to think more in terms of annual. ARR, Annualized growth rates, what is the net dollar retention over a year? The lifespan of the company is bigger and you should start to think in terms of years and not months or quarters.”
Nick Franklin, CEO ChartMogul
So what’s new in ChartMogul?
Previously, retention rates in ChartMogul were only available as a cohort of customers who joined in a particular month.
But with NRR and GRR charts now, you can track your retention rates across your full customer base. In addition, you can break the retention rates by month, quarter, and year if you like – so you can better understand and improve your business over time.
Find product-market fit
Now that you know your retention rates, you can segment these metrics to identify the groups of customers with whom you have product-market fit.
The first step is to filter by plan, vertical, company size, or other firmographic data. You can send any other data you like to ChartMogul (from your CRM for example) via Zapier, Google Sheets, or our Enrichment API.
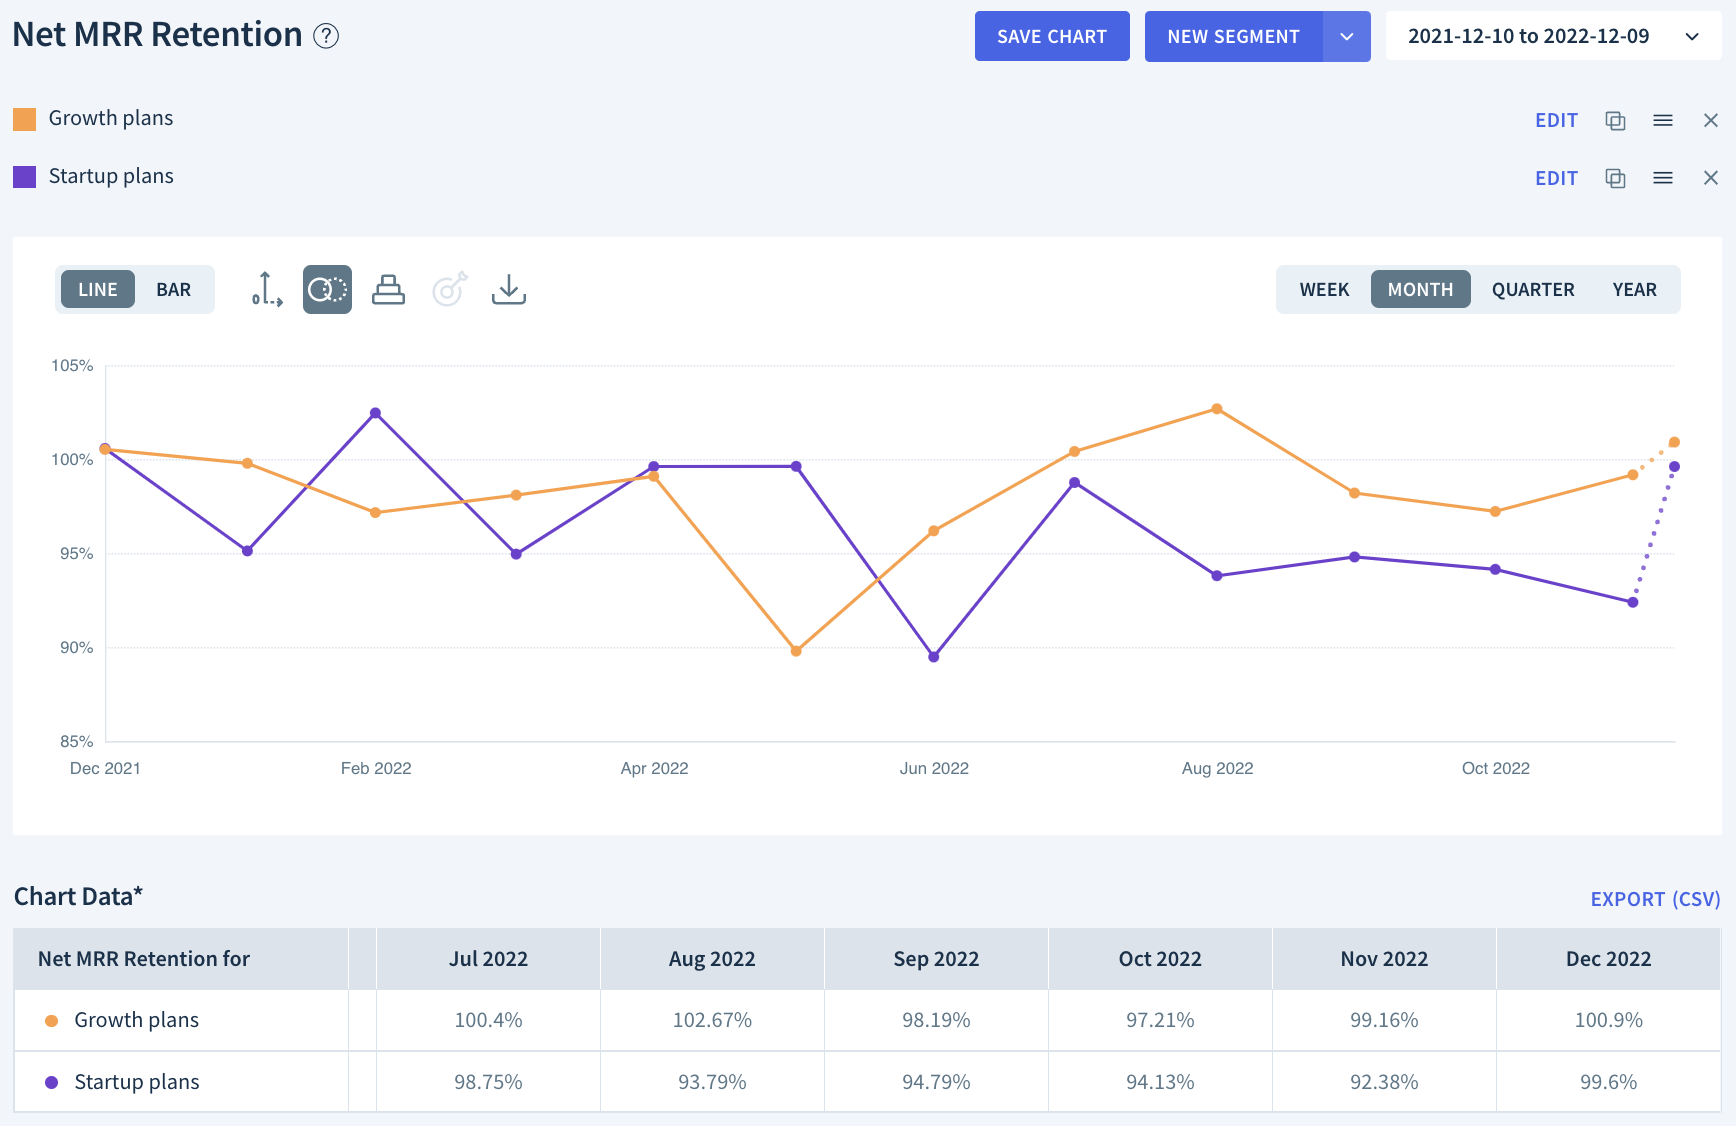
Find the groups of customers with a higher than average retention rate and build a plan to better focus your marketing efforts on acquiring more of them. You can dig into your customer feedback and figure out how you can better improve your product for these customers and what new features you should be working on.
The opposite is also true. Segmentation can help you find out which customers have lower retention rates – customers your product might not be a fit for – and then you can reduce your costs trying to market to them.
Tell an effective growth story
High retention rates tell potential investors that you’re gaining more value from existing customers and that those customers are sticking with you.
If you’re a successful company, your NRR will likely exceed 100%. That means you’re growing your company even if you’re not actively signing new accounts. These companies are growing more quickly and are more cash efficient than companies with lower NRR.
This metric is vastly important to investors evaluating the long-term sustainability of your business. If you’re curious about the difference between good and great retention rates you can read more about them here.
Net and Gross MRR Retention Rate charts have been our most requested features and we’re excited to finally release them.
Tell us what you think of NRR/GRR and share your thoughts on what we should build next.