
ChartMogul is a product-led company. Since our inception, we have focused on building a product that our customers love and helps them grow their recurring revenue faster. Along the way, we have been documenting our findings and providing useful content to the SaaS community.
This contributes to our acquisition strategy as well. We have a lot of trials every day, and the bulk of our customers start their buying journey with our content. So unquestionably, free trials are super important for us and we make sure we help our users succeed.
However, not all trials are the same. Trials are different not only in terms of what type of user is trialing ChartMogul, but also in terms of user setup and how they are using our product.
Here we will explore the combination of the two elements, and how they help us identify best-fit and poor-fit customer segments. This will then be used in our marketing efforts to eliminate false signals from the poor-fit trials and improve our reach to good-fit ones. Let’s dig in.
Types of customer segments
There are several characteristics we can use for our customer segmentation. These include:
- Company size
- Location
- Free email vs company email
- Other characteristics from the signup form and/or via customer enrichment tools
Similarly, there are a lot of characteristics that come from product usage. For example:
- Has the user connected their billing data?
- Is that billing data in the right form/does the customer see their key metrics such as MRR?
- How often is the user logging in during the trial?
- More usage-based attributes
Some segments are quite straightforward to generate. For instance, a customer that fits our ideal company size, from our focus regions, signed up with their business email, has imported all their data, and keeps logging in, is obviously a very high-quality lead.
On the other hand, a user signing up with a free email account, from a country that is not traditionally strong for us and doesn’t connect billing data or show interesting activity, could very well be a bad-fit or a user that was probably looking for something else. These low-quality trials can wreak havoc on the data we use to make decisions.
In our case, we have a long history of trials that were actually trying to find “chatmogul”, a product with a similar sounding name, but very different in every other regard. Especially in certain periods, the new trials from users that were actually searching for “chatmogul” were actually impactful in our numbers. I’m sure you can relate – not all leads are created equal. Let me walk you through how we can use ChartMogul’s Enrichment API to segment out the poor quality leads and produce more accurate data.
Defining and creating the segments
Once a new trial gets created, we start tracking them at our own ChartMogul account. We track metrics such as the number of trials for the period, trial-to-paid conversion rate, and other such leads and trials metrics. We typically do a lot of segmentation to better understand the leads that come in, however it might be necessary to add more data to each customer profile through custom attributes in order to arrive at better-defined groups
The first thing we do is to define the segments and custom attributes we need to create, so that we can identify the rules and logic that represent this segment. To the example above, a good custom attribute definition would be “is_chatmogul”, with possible values either “true/false” or “high/med/low” depending on the confidence level.
The second step is to define the inputs to be used for that segment. In this case, they would be “Company size”, “Country”, “Email”, “Phone number”, “Data import”, “Last login”, “Customer status”.
The next step is to identify the sources of that information:
- Company size is a field that customers self-identify at sign-up. Alternatively, there are multiple customer enrichment tools that can be used for this purpose.
- Country/region is something we identify through Intercom and/or assisted by other sources of information such as their phone number.
- Email is being registered at sign up, hence we can easily identify if it is a free email or a work email address.
- Phone number, which is also being requested at sign up
- Data import, Last Login, Customer Status etc are product information we get from ChartMogul itself.
Once we have the raw data, it’s possible to define the logic for the definition of “is_chatmogul”:
- “Chatmogul” leads that we try to identify are typically based in a specific region. We create a list of these countries.
- Since they are not subscription businesses, they typically just sign up and realize it’s the wrong service. That means that all usage based attributes are zero or close to that.
- They are consumers and not businesses, so they would typically sign up with their gmail account.
- Sometimes the country would not be captured at all, but the phone number is available. The country code of the phone number though helps in identifying the region.
Taking all the above into account, we transform that logic into a script, where we identify each case in a typical IF/THEN/ELSE scenario. This was done once for all historical data, and will continue to apply for every new lead.
Finally, after we had all the information, we use ChartMogul’s Enrichment API to push the information to our application, and then create the relevant segments. Alternatively, you can always send the enrichment data via a no-code tool such as Zapier.
Understanding the business impact of the false trials
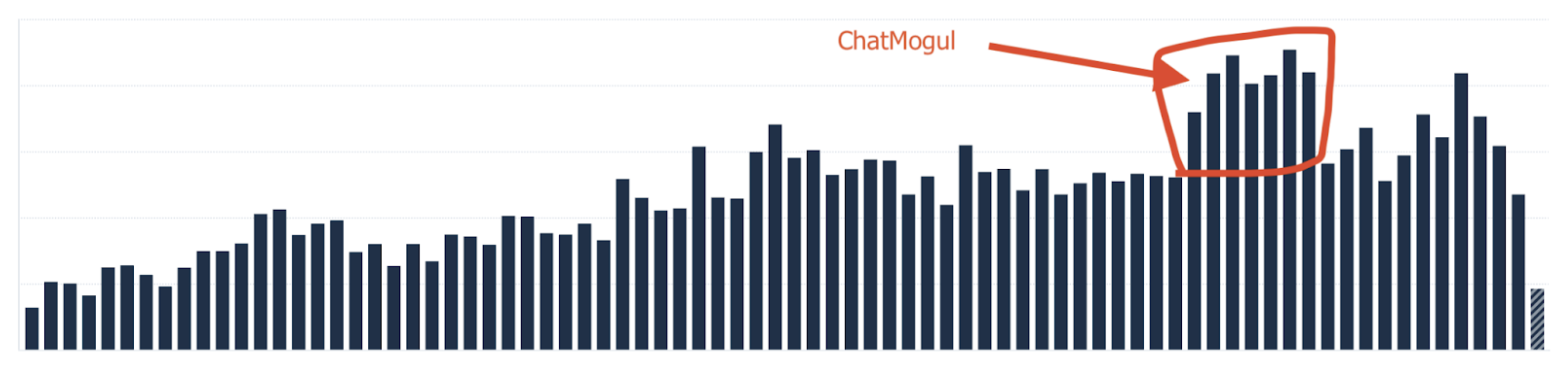
The additional information on a lead level proved very important to understand the real trials and conversion rates. More interestingly, there were a few spikes in the number of trials, which was very interesting to identify their source.
This is an example of new trials without any segmentation.
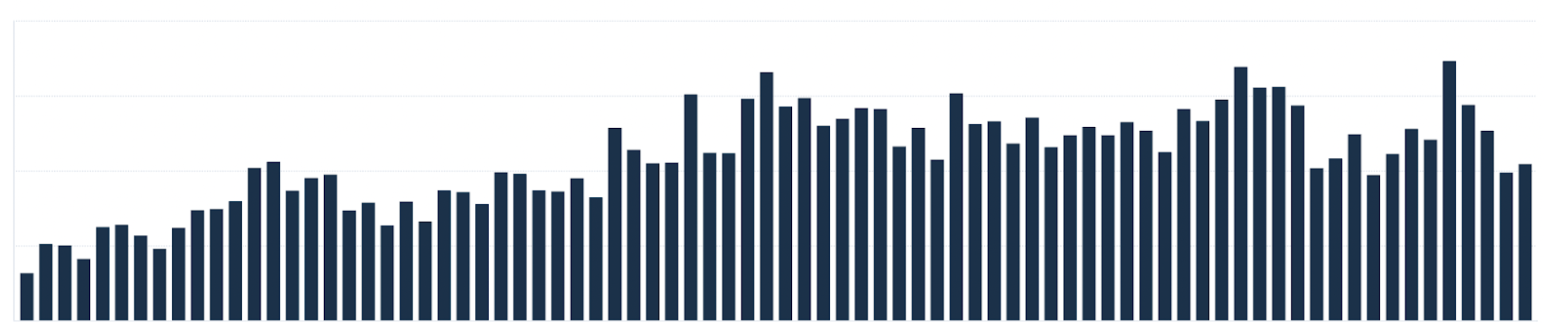
The below figure shows the same metric in the same timeframe, but after filtering out a specific segment that we had identified and accounted for. So after removing its impact, it turned out that the number of leads coming in was normal.
Next steps
I hope that this study can help you reflect a bit on what can be improved in your own data (and how to use segmentation to do so). Next up, the revenue team and myself are working towards a more advanced attribution model, taking into account the various sources of leads such as content marketing, organic search etc, and the detailed sources and campaigns that initiated the lead generation. Stay tuned for more updates in the coming months.